Is now a bad time to drive in Sarasota?
About normal for Sarasota. FDOT's seasonal factors put countywide traffic in the week of 10/26/2025–11/01/2025 (2025 pattern) at -2.9% vs. the annual average.
Live right now
We don't run a live feed (see "How we know"). For live conditions, use the official maps:
- FL511 live traffic map (FDOT): Official statewide live incidents, closures, travel times and cameras.
- Sarasota County Traffic Engineering & Operations: Road and lane closures, annual crash reports, arterial performance reports.
- Florida Traffic Online (FDOT): FDOT traffic counts, site reports and seasonal factors.
- Local chatter: Sarasota traffic Facebook group. A community group, not an official source. Nothing from it is copied or used as data here.
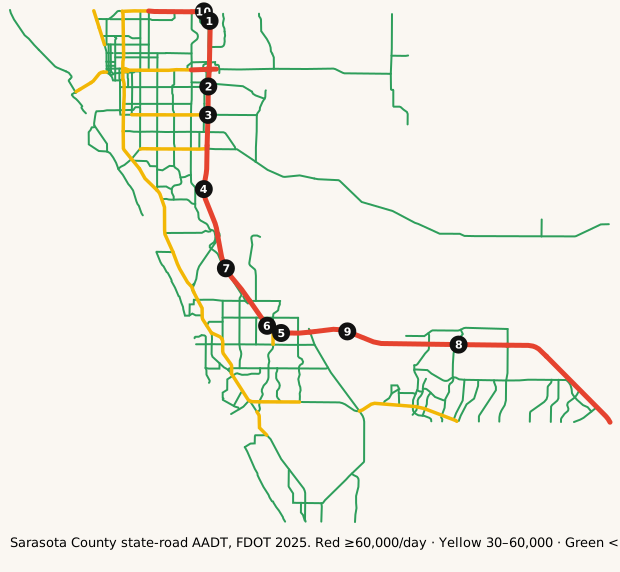
Map: where it's busy
Red means a lot of cars. Not great for your blood pressure either.
Legend: ■ 60,000+ vehicles/day · ■ 30,000–60,000 · ■ under 30,000 (our bins). ① – ⑩ = busiest segments. Tap a road for details. Static map · Report a map issue
Times to avoid
By season (real, FDOT): each segment's popup lists its three busiest weeks from FDOT's 2025 seasonal factors. I-75 uses category 1775, US 41/US 301 use 1701, SR 776 uses 1702, and other roads use the countywide category 1700.
By hour (real, FDOT counting stations): FDOT's continuous counters in Sarasota County publish hourly counts. We averaged every day FDOT flagged "normal" in 2025:
Station 170181: SR-45/US-41,600' NW OF SPRINGFIELD DR,SARASOTA CO.
Two-way weekday average. Busiest hours: 4–5 p.m. (2,982 veh/hr), 5–6 p.m. (2,860 veh/hr), 3–4 p.m. (2,802 veh/hr). By direction: northbound peaks 8–9 a.m. (1,447 veh/hr, 243 normal weekdays); southbound peaks 4–5 p.m. (1,663 veh/hr, 234 normal weekdays).
Station 170225: SR-93/I-75,0.7 MI N SR72@PROCTOR RD OP,SARASOTA CO
Two-way weekday average. Busiest hours: 7–8 a.m. (9,385 veh/hr), 8–9 a.m. (9,168 veh/hr), 3–4 p.m. (9,035 veh/hr). By direction: northbound peaks 7–8 a.m. (5,096 veh/hr, 155 normal weekdays); southbound peaks 4–5 p.m. (4,927 veh/hr, 151 normal weekdays).
Station 179967: SR-93/I-75 @PONCE DE LEON BLVD O/P, SARASOTA CO.
Two-way weekday average. Busiest hours: 4–5 p.m. (6,673 veh/hr), 5–6 p.m. (6,469 veh/hr), 3–4 p.m. (6,314 veh/hr). By direction: northbound peaks 7–8 a.m. (4,426 veh/hr, 218 normal weekdays); southbound peaks 5–6 p.m. (4,440 veh/hr, 194 normal weekdays).
Math: avg[hour] = Σ volume[hour] on FDOT "N" (normal) weekdays ÷ number of those days, per direction. Two-way = northbound + southbound. Holidays, special events and atypical days are excluded. We read FDOT's hour columns as hour 1 = midnight–1 a.m. Source: FDOT Florida Traffic Online, Hourly Continuous Counts Final Report, 2025, per station.
Everywhere else: FDOT's K-factor (about 9% on these roads) is a standard design value: the share of daily traffic expected in the design peak hour. It is not a measured local rush hour, so we don't turn it into times.
The year, best to worst
Months ranked by average weekly traffic vs. the annual average (Sarasota countywide). 5 = quietest. ▶ marks this month.
Quietest stretch
Week of 09/14/2025: -9.9%. Late summer into September is the low point.
Busiest stretch
FDOT's peak season (marked weeks): 01/26/2025 – 04/26/2025. Busiest week: 02/23/2025, +12.4%.
The busiest roads
Ranked by average daily vehicles. Bring snacks for anything near the top.
| Corridor | Avg AADT | Peak segment | Miles | K |
|---|---|---|---|---|
| I-75 | 92,156 | 139,000 | 42.6 | 9.0% |
| University Parkway | 50,719 | 69,500 | 6.9 | 9.0% |
| US 301 / Washington Blvd | 39,627 | 44,500 | 4.2 | 9.0% |
| US 41 / Tamiami Trail | 39,252 | 59,500 | 42.6 | 9.0% |
| Bee Ridge Road (SR 758) | 37,065 | 42,500 | 5.4 | 9.0% |
| Fruitville Road (SR 780) | 20,215 | 62,500 | 20.3 | 9.4% |
| Clark Road / Stickney Point (SR 72) | 10,524 | 40,500 | 30.6 | 9.1% |
Formula: Avg AADT = Σ(segment AADT × segment miles) ÷ Σ(segment miles), using FDOT's 2025 AADT segments in Sarasota County (mileposts from FDOT). K = FDOT's K-factor, the share of a day's traffic in the design peak hour (averaged across segments).
Busiest single segments, 2025:
| Road | From → To | AADT |
|---|---|---|
| I-75 | Bridge No-170083 → MANATEE CO LINE | 139,000 |
| I-75 | Bridge No-170145 → Bridge No-170083 | 133,500 |
| I-75 | N/A → Bridge No-170145 | 127,695 |
| I-75 | 17005102 OFF → N/A | 110,500 |
| I-75 | Bridge No-170090 → Bridge No-170096 | 102,000 |
| I-75 | Bridge No-170096 → LAUREL ROAD | 97,000 |
| I-75 | LAUREL ROAD → 17005102 OFF | 91,000 |
| I-75 | Bridge No-170139 → Bridge No-170129 | 76,500 |
| I-75 | Bridge No-170129 → Bridge No-170090 | 70,000 |
| UNIVERSITY PKWY | N/A → OFF 17075003 | 69,500 |
| I-75 | CHARLOTTE CO LINE → N/A | 64,500 |
| I-75 | N/A → Bridge No-170139 | 64,500 |
AADT is the annual average number of vehicles per day on a segment. High volume isn't the same as congestion: I-75 carries the most because it has the most lanes. FDOT's From/To labels are shown as published ("N/A" or bridge numbers are FDOT's own).
How we know
- FDOT Annual Average Daily Traffic (Roadway Characteristics Inventory, public GIS service; FDOT provides it "as is").
- FDOT 2025 Peak Season Factor Category Report, Sarasota Countywide (category 1700), from Florida Traffic Online.
Weekly verdict: FDOT's seasonal factor (SF) converts a week's count to the annual average (AADT = weekly volume × SF). So the week's traffic vs. average is index = 1 ÷ SF − 1. Rule (our thresholds): over +5% = Bad, −3% to +5% = Meh, under −3% = Good. This week: SF 1.03 → -2.9% → Meh. We use the 2025 factors and match by calendar date.
All 53 weeks (2025)
| Week | Dates | SF | vs. avg | Peak |
|---|---|---|---|---|
| 1 | 01/01/2025–01/04/2025 | 1.02 | -2.0% | |
| 2 | 01/05/2025–01/11/2025 | 1.01 | -1.0% | |
| 3 | 01/12/2025–01/18/2025 | 0.99 | +1.0% | |
| 4 | 01/19/2025–01/25/2025 | 0.97 | +3.1% | |
| 5 | 01/26/2025–02/01/2025 | 0.95 | +5.3% | * |
| 6 | 02/02/2025–02/08/2025 | 0.92 | +8.7% | * |
| 7 | 02/09/2025–02/15/2025 | 0.9 | +11.1% | * |
| 8 | 02/16/2025–02/22/2025 | 0.9 | +11.1% | * |
| 9 | 02/23/2025–03/01/2025 | 0.89 | +12.4% | * |
| 10 | 03/02/2025–03/08/2025 | 0.89 | +12.4% | * |
| 11 | 03/09/2025–03/15/2025 | 0.89 | +12.4% | * |
| 12 | 03/16/2025–03/22/2025 | 0.89 | +12.4% | * |
| 13 | 03/23/2025–03/29/2025 | 0.9 | +11.1% | * |
| 14 | 03/30/2025–04/05/2025 | 0.91 | +9.9% | * |
| 15 | 04/06/2025–04/12/2025 | 0.91 | +9.9% | * |
| 16 | 04/13/2025–04/19/2025 | 0.92 | +8.7% | * |
| 17 | 04/20/2025–04/26/2025 | 0.94 | +6.4% | * |
| 18 | 04/27/2025–05/03/2025 | 0.97 | +3.1% | |
| 19 | 05/04/2025–05/10/2025 | 0.99 | +1.0% | |
| 20 | 05/11/2025–05/17/2025 | 1.01 | -1.0% | |
| 21 | 05/18/2025–05/24/2025 | 1.02 | -2.0% | |
| 22 | 05/25/2025–05/31/2025 | 1.03 | -2.9% | |
| 23 | 06/01/2025–06/07/2025 | 1.03 | -2.9% | |
| 24 | 06/08/2025–06/14/2025 | 1.04 | -3.8% | |
| 25 | 06/15/2025–06/21/2025 | 1.05 | -4.8% | |
| 26 | 06/22/2025–06/28/2025 | 1.05 | -4.8% | |
| 27 | 06/29/2025–07/05/2025 | 1.06 | -5.7% | |
| 28 | 07/06/2025–07/12/2025 | 1.06 | -5.7% | |
| 29 | 07/13/2025–07/19/2025 | 1.06 | -5.7% | |
| 30 | 07/20/2025–07/26/2025 | 1.06 | -5.7% | |
| 31 | 07/27/2025–08/02/2025 | 1.07 | -6.5% | |
| 32 | 08/03/2025–08/09/2025 | 1.07 | -6.5% | |
| 33 | 08/10/2025–08/16/2025 | 1.08 | -7.4% | |
| 34 | 08/17/2025–08/23/2025 | 1.08 | -7.4% | |
| 35 | 08/24/2025–08/30/2025 | 1.09 | -8.3% | |
| 36 | 08/31/2025–09/06/2025 | 1.09 | -8.3% | |
| 37 | 09/07/2025–09/13/2025 | 1.1 | -9.1% | |
| 38 | 09/14/2025–09/20/2025 | 1.11 | -9.9% | |
| 39 | 09/21/2025–09/27/2025 | 1.09 | -8.3% | |
| 40 | 09/28/2025–10/04/2025 | 1.07 | -6.5% | |
| 41 | 10/05/2025–10/11/2025 | 1.06 | -5.7% | |
| 42 | 10/12/2025–10/18/2025 | 1.04 | -3.8% | |
| 43 | 10/19/2025–10/25/2025 | 1.04 | -3.8% | |
| 44 | 10/26/2025–11/01/2025 | 1.03 | -2.9% | |
| 45 | 11/02/2025–11/08/2025 | 1.03 | -2.9% | |
| 46 | 11/09/2025–11/15/2025 | 1.02 | -2.0% | |
| 47 | 11/16/2025–11/22/2025 | 1.02 | -2.0% | |
| 48 | 11/23/2025–11/29/2025 | 1.02 | -2.0% | |
| 49 | 11/30/2025–12/06/2025 | 1.02 | -2.0% | |
| 50 | 12/07/2025–12/13/2025 | 1.02 | -2.0% | |
| 51 | 12/14/2025–12/20/2025 | 1.02 | -2.0% | |
| 52 | 12/21/2025–12/27/2025 | 1.01 | -1.0% | |
| 53 | 12/28/2025–12/31/2025 | 0.99 | +1.0% |
Not used yet: hour-by-hour and crash-by-hour patterns. The public FDOT crash service carries use restrictions (23 U.S.C. §409), and live feeds need agreements, so we're asking first. Worst-hour charts are coming once that's sorted.
Last updated: AADT fetched October 26, 2026; page rebuilt October 26, 2026.