A Bad Time On The Roads · Pinellas County
Tampa Bay Area master map — Hillsborough, Pinellas & Manatee combined.
Is now a bad time to drive in St. Pete?
Saved only in your browser.
Live feed shows official trouble in Pinellas County. Weekly FDOT seasonal factors for Pinellas County aren't on this page yet. The badge follows today's live FDOT incidents (refreshed every 5 minutes). AADT map below is from FDOT 2025 counts.
Live right now
1 incident · 0 full road closures · 0 signal issues · 2 scheduled road work in Pinellas County.
3 pins for incidents / full closures / signals (verdict drivers). Red = Bad · Amber = Meh. Closures without coordinates stay in the list.
Incidents (1)
- Disabled Vehicle SR 600/Gandy Blvd @ Brighton Bay Blvd Right lane blocked
Disabled vehicle in Pinellas County on SR 600/Gandy Blvd East, at Brighton Bay Blvd. Right lane blocked.
Florida Department of Transportation · updated 08/31/2026 3:32:27 PM ET
📷 Nearby cameras: at Brighton Bay (334 m) · WB at 4th St N (984 m)
Scheduled road work (2)
Listed for awareness; does not change the live label (only full road closures and incidents do).
- Scheduled Road Work SR 690/Gateway Expressway @ MM 2 Left lane blocked
Planned construction in Pinellas County on SR 690/Gateway Expressway West, before MM 2. Left lane blocked.
Florida Department of Transportation · updated 10/27/2026 10:29:06 PM ET
📷 Nearby cameras: SR-690 at MM 2.6 (130 m) · SR-690 at MM 2.7 (172 m) - Scheduled Road Work I-275 @ 38th Ave N Off-ramp closed
Planned construction in Pinellas County on I-275 South, ramp to 38th Ave N. Off-ramp closed.
Florida Department of Transportation · updated 10/27/2026 6:02:31 AM ET
📷 Nearby cameras: I-275 median at 38th Ave N (368 m) · I-275 NB at 54th Ave N (1.2 km)
Sources, rule and fine print
- FDOT DIVAS traffic events (Florida Department of Transportation): ok, 3 in Pinellas County. Public FDOT GIS service, no key. FDOT provides data "as is".
Live label (our rule): Only incidents, full road closures, and signal issues set the badge. Math: Bad = any signal, any full road closure, or a crash / major or intermediate-severity incident; Meh = any other incident; Good = none of those. Permitted lane/utility work and other non-full scheduled work are listed separately and do not change Bad/Meh/Good. Counts are what the agencies list; we don't invent any.
Signal outages: appear here only when FDOT posts them to its event feed.
📷 Nearby cameras: FL511 (FDOT) cameras within 1.5 km of the reported location, straight-line. Stills are hot-linked from fl511.com (not stored or proxied here) and refresh in your browser while this page is open.
Times are Eastern. Incident text is pulled server-side. The optional map loads Leaflet from abadtime.com and map tiles from tile.openstreetmap.org (OSM tile policy; low volume, attribution shown). Camera links open fl511.com. Not for navigation or emergencies.
County road & lane closures
Source: Pinellas County (one.network) · ArcGIS Experience. Official Pinellas County roadway construction advisory map (powered by Causeway one.network). No public keyless FeatureServer of closures was available, so we embed their map and do not scrape one.network.
Official live maps:
- FL511 live traffic map (FDOT): Official statewide live incidents, closures, travel times and cameras.
- Pinellas County roadway advisories: County construction and closure advisory map.
- Florida Traffic Online (FDOT): FDOT traffic counts, site reports and seasonal factors.
Traffic cameras (152)
Each link opens that camera on the official FL511 map (FDOT) via #camera-{id}. We don't host, copy or re-stream any images or video. Pinellas County; list checked daily, last on Oct 27.
I-275 (80)
- I-275 at MM 28.1 Northbound
- I-275 37.8 SB A Southbound
- E7R10 37.7 SB B Southbound
- I-275 37.7 Southbound
- MM 37.5 SB Southbound
- I-275 NB S of SR-60 Northbound
- I-275 37.4 SB Southbound
- I-275 at MM 36.5 SB Southbound
- I-275 at MM 36.8 NB Northbound
- I-275 at MM 36.1 SB Southbound
- I-275 at MM 35.7 SB Southbound
- I-275 at HowardFrank Br Hump Southbound
- E7R10 35.2 SB Southbound
- E7R10 35.0 SB Southbound
- MM 34.5 NB Northbound
- E7R10 34.3 SB Southbound
- E7R10 34.2 SB Southbound
- Bosch Onvif Test CCTV Northbound
- E7R10 33.7 SB Southbound
- E7R10 33.7 NB Northbound
- E7R10 33.3 SB Southbound
- E7R10 33.3 SB Southbound
- E7R10 33.0 SB Southbound
- E7R10 33.0 NB Northbound
- E7R10 32.7 NB Northbound
- E7R10 32.5 NB N of 4th St Northbound
- E7R10 32.5 NB Northbound
- E7R10 32.3 NB Northbound
- E7R10 32.3 NB Northbound
- E7R10 32.0 NB Northbound
- E7R10 32.0 NB Northbound
- I-275 at MM 31.7 Southbound
- I-275 4th St N Overpass Southbound
- I-275 SB at 4th St N Southbound
- E7R10 4th St Northbound
- I-275 SB at Ulmerton Rd Southbound
- I-275 at MM 29.9 Ramp Northbound
- I-275 at MM 29.5 Southbound
- I-275 at MM 29.4 Southbound
- I-275 at MM 29.1 Southbound
- I-275 at MM 28.6 Northbound
- I-275 at S of Roosevelt Blvd Southbound
- I-275 at MM 28.2 Northbound
- I-275 at MM 28.5 Northbound
- I-275 at MM 28.1 Northbound
- I-275 at MM 28.1 Northbound
- I-275 at MM 27.7 Northbound
- I-275 at MM 27.7 Northbound
- I-275 at Gandy Blvd Southbound
- I-275 at MM 27.6 Northbound
- I-275 at MM 26.6 Northbound
- I-275 N of 54th Ave N Southbound
- I-275 NB at 54th Ave N Northbound
- I-275 median at 38th Ave N Northbound
- I-275 NB at 22nd Ave N Northbound
- I-275 median at 5th Ave N Northbound
- I-275 median at 28th St S Northbound
- I-275 SB at 31st St ramp Southbound
- I-275 median at 22nd Ave S Northbound
- I-275 median at 38th Ave S Northbound
- I-275 median at 54th Ave S Northbound
- I-275 S at 16.9 SB Southbound
- I-275 N at 16.1 NB Northbound
- I-275 NB at North Toll Northbound
- I-275 S of North Toll Southbound
- I-275 N at 14.5 NB Northbound
- I-275 S at 14.1 SB Southbound
- I-275 N at 13.9 NB Northbound
- I-275 at N Rest Area Southbound
- I-275 SB south of North Rest Area Southbound
- I-275 SB at North fishing pier Southbound
- I-275 S at North End of Bridge Southbound
- I-275 SB before North Tower Southbound
- I-275 NB on North Tower, CCTV 14 Northbound
- I-275 SB on North Tower, CCTV 13 Southbound
- I-275 NB on South Tower Northbound
- I-275 SB on South Tower Southbound
- I-275 S of South Tower, CCTV 10 Southbound
- I-275 S at South End of Bridge Southbound
- I-275 SB at South Fishing Pier, CCTV 8 Southbound
Veterans Expressway (21)
- SR-589 S at MM 10.5 Southbound
- SR-589 S at MM 10.2 Southbound
- SR-589 S at MM 10.2 Southbound
- SR-589 S at MM 009.8 Southbound
- SR-589 S at MM 009.8 Southbound
- SR-589 N at MM 009.7 Northbound
- SR-589 S at MM9.5 Southbound
- SR-589 Median at MM 9.4 Northbound
- SR-589 S at MM 9.3 Southbound
- SR-589 at MM 9.2 SB Southbound
- SR-589 at MM 9.0 SB Southbound
- SR-589 S at MM 8.6 Southbound
- SR-589 S at MM 8.4 Northbound
- SR-589 N at MM 8.4 Northbound
- SR-589 N at MM 8.3 Northbound
- SR-589 S at MM 8.0 Southbound
- SR-589 median at MM 7.6 Northbound
- SR-589 at MM 7.5 SB Southbound
- SR-589 at MM 7.5 SB Southbound
- SR-589 median at MM 7.2 Northbound
- SR-589 at MM 6.7 SB Southbound
SR 690/Gateway Expressway (13)
- SR-690 at MM 0.9 Westbound
- SR-690 at MM 2.8 Eastbound
- SR-690 at MM 2.8 Westbound
- SR-690 at MM 1.6 Eastbound
- SR-690 at MM 1.6 Eastbound
- SR-690 at MM 1.4 Eastbound
- SR-690 at MM 2.0 Eastbound
- SR-690 at MM 2.3 Eastbound
- SR-690 at MM 2.4 Eastbound
- SR-690 at MM 2.3 Eastbound
- SR-690 at MM 2.6 Eastbound
- SR-690 at MM 2.7 Eastbound
- SR-690 at MM 2.7 Eastbound
SR 60 (11)
- CCC at MM HIC 3.2 Westbound
- CCC at Boat Ramp Eastbound
- CCC at MM HIC 4.2 Westbound
- CCC at MM HIC 1.8 Westbound
- CCC at MM HIC 1.0 Westbound
- CCC at MM HIC 4.9 Eastbound
- CCC West of Bayport Eastbound
- CCC at MM PIN 11.2 Eastbound
- CCC at MM PIN 10.2 Westbound
- CCC at MM PIN 09.2 Westbound
- CCC at MM PIN 08.3 Eastbound
SR 682/Pinellas Bayway (6)
- at Toll Plaza Eastbound
- Ramp to 54th Ave S Westbound
- at Leeland St S Eastbound
- at Sun Blvd Westbound
- East of Delgado Mem. Bridge Eastbound
- West of Delgado Mem. Bridge Westbound
SR 600/Gandy Blvd (4)
- West of Gandy Bridge Eastbound
- at Brighton Bay Westbound
- WB at 4th St N Westbound
- EB at 4th St N Eastbound
SR 694/Gandy Blvd (4)
- SR-694 at MM 5.5 WB Westbound
- at 9th St North A Westbound
- [not provided] Westbound
- at I-275 Eastbound
SR 686A/Roosevelt (3)
- SR-686A at MM 6.1 Westbound
- SR-686A at MM 1.9 Westbound
- SR-686A at MM 2.6 Eastbound
for Pinellas County cameras (2)
- CCTV at Bryan Dairy Eastbound
- [not provided] Eastbound
SR 679/Pinellas Bayway (2)
- SR 679 - NORTH SIDE OF BRIDGE Northbound
- SR 679 & MADONNA BLVD Northbound
Cr 611/Bayside Bridge (1)
- CR-611 at MM 0.0 Southbound
for City of Tampa cameras (1)
I-175 (1)
- I-175 at I-275 Westbound
SR 686 (1)
- SR-686 at MM 5.0 Eastbound
SR 688 (1)
- SR-688 at MM 9.3 Eastbound
US 19 (1)
- US-19 N of 50 Ave S Southbound
Source: FL511 camera list, Florida Department of Transportation. FL511 says video and images are neither stored nor recorded; FDOT information is not for re-sale or re-use, so we only link.
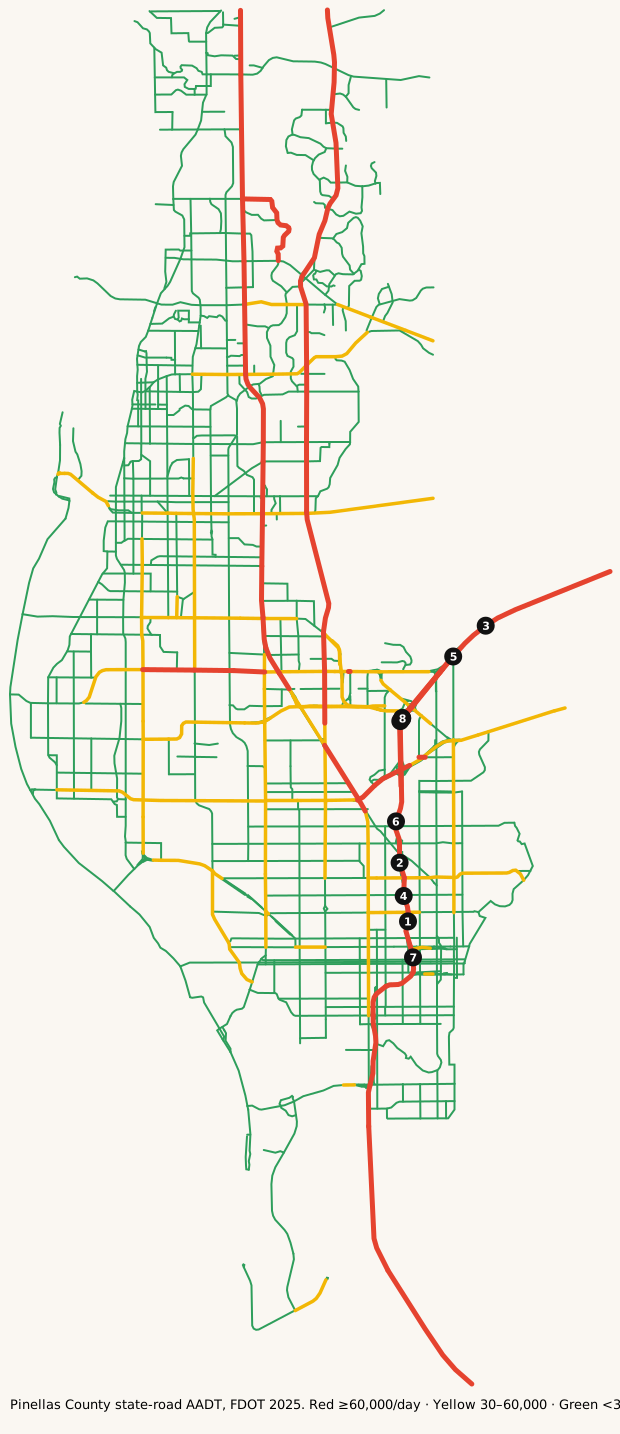
Map: where it's busy
FDOT annual average daily traffic on state roads in Pinellas County.
Legend: ■ 60,000+ vehicles/day · ■ 30,000–60,000 · ■ under 30,000 (our bins). Static map · Report a map issue
The busiest roads
Ranked by average daily vehicles. Bring snacks for anything near the top.
| Corridor | Avg AADT | Peak segment | Miles | K |
|---|---|---|---|---|
| I-275 | 149,591 | 185,000 | 20.4 | 8.2% |
| I-275 EXPRESS LANES | 140,000 | 140,000 | 6.4 | 8.0% |
| LAKE ST GEORGE DR | 95,391 | 130,000 | 4.3 | 9.0% |
| 34 ST S | 80,518 | 131,000 | 32.3 | 9.0% |
| SKYWAY CAUSEWAY | 69,651 | 69,651 | 4.3 | 8.0% |
| SKYWAY BRG | 69,651 | 69,651 | 4.1 | 8.0% |
| MCMULLEN BOOTH RD | 67,621 | 69,000 | 4.3 | 9.0% |
| EAST LAKE RD | 61,500 | 61,500 | 10.7 | 9.0% |
Formula: Avg AADT = Σ(segment AADT × segment miles) ÷ Σ(segment miles), using FDOT's 2025 AADT segments in Pinellas County.
Busiest single segments, 2025:
| Road | From → To | AADT |
|---|---|---|
| I-275 | Bridge No-150121 → Bridge No-150090 | 185,000 |
| I-275 | Bridge No-150092 → 54 AVE N | 180,000 |
| I-275 | 4 ST N → END BRIDGE 150107 | 174,000 |
| I-275 | Bridge No-150090 → Bridge No-150092 | 172,000 |
| I-275 | N/A → 4 ST N | 172,000 |
| I-275 | 54 AVE N → Bridge No-150100 | 169,000 |
| I-275 | Bridge No-150121 → Bridge No-150121 | 144,000 |
| I-275 | Bridge No-150100 → Bridge No-150102 | 141,000 |
| I-275 EXPRESS LANES | → | 140,000 |
| I-275 EXPRESS LANES | → | 140,000 |
| I-275 | Bridge No-150102 → N/A | 140,000 |
| 34 ST S | Bridge No-150273 → Bridge No-150260 | 131,000 |
AADT is the annual average number of vehicles per day on a segment. High volume isn't the same as congestion: freeways often carry the most because they have the most lanes.
How we know
- FDOT Annual Average Daily Traffic (Roadway Characteristics Inventory; public, "as is").
- Live list: FDOT DIVAS traffic events. Pulled server-side every 5 minutes. Public FDOT GIS service, no key. FDOT provides data "as is".
- Cameras: FL511 camera list (FDOT). Stills hot-linked from fl511.com; not stored here.
FAQ
What area does this cover?
Pinellas County, Florida (St. Pete / Clearwater). Live incidents come from FDOT's DIVAS event feed filtered to that county.
How often does the live list update?
Every 5 minutes. The page is rebuilt from official feeds server-side; we don't invent counts.
Where do the traffic numbers come from?
FDOT Roadway Characteristics Inventory annual average daily traffic (AADT) for state roads in Pinellas County, plus FL511 cameras. FDOT provides the data "as is".
Is this for navigation or emergencies?
No. For live routing use FL511 or your maps app. In an emergency call 911.
Last updated: AADT fetched October 27, 2026; page rebuilt October 27, 2026.